For older people and frail people, the long-term benefit of medicines reduces and the potential for harm from adverse effects increases. When the benefit–risk balance changes in this way, medicine review and optimisation are important to simplify the therapeutic regimen, reduce inappropriate medicines and minimise risks. In this article, pharmacist prescriber Linda Bryant uses two case studies to illustrate important considerations during medicine reviews
Five per cent of what? The quirks behind how much of Vote Health goes into primary care
Five per cent of what? The quirks behind how much of Vote Health goes into primary care

Kia ora, please enjoy our Summer Hiatus selection of stories and comment from throughout 2023, curated by our editorial team. This article was first published on 24 May. We will be back from our summer break on 15 January. Happy reading
Chosen by Fiona: Seven shillings and sixpence was the first patient subsidy paid to GPs back in 1941. This is one of the historic titbits I discovered and shared when trying to unravel how much of Vote Health ends up in general practice’s pockets in 2023. Read on for more on funding back then… and now
Last year’s Budget allocated $24 billion to Vote Health – a tidy sum in anyone’s book.
GPs and nurses say a bigger share of those dollars needs to head general practice’s way to make primary care sustainable; they chorus that primary care funding reform is long overdue.
But how much of the health allocation is distributed to the country’s 1000 or so general practices to deliver care to their 4.8 million enrolled patients?
At first glance, and second glance, the Budget documents never make this clear.
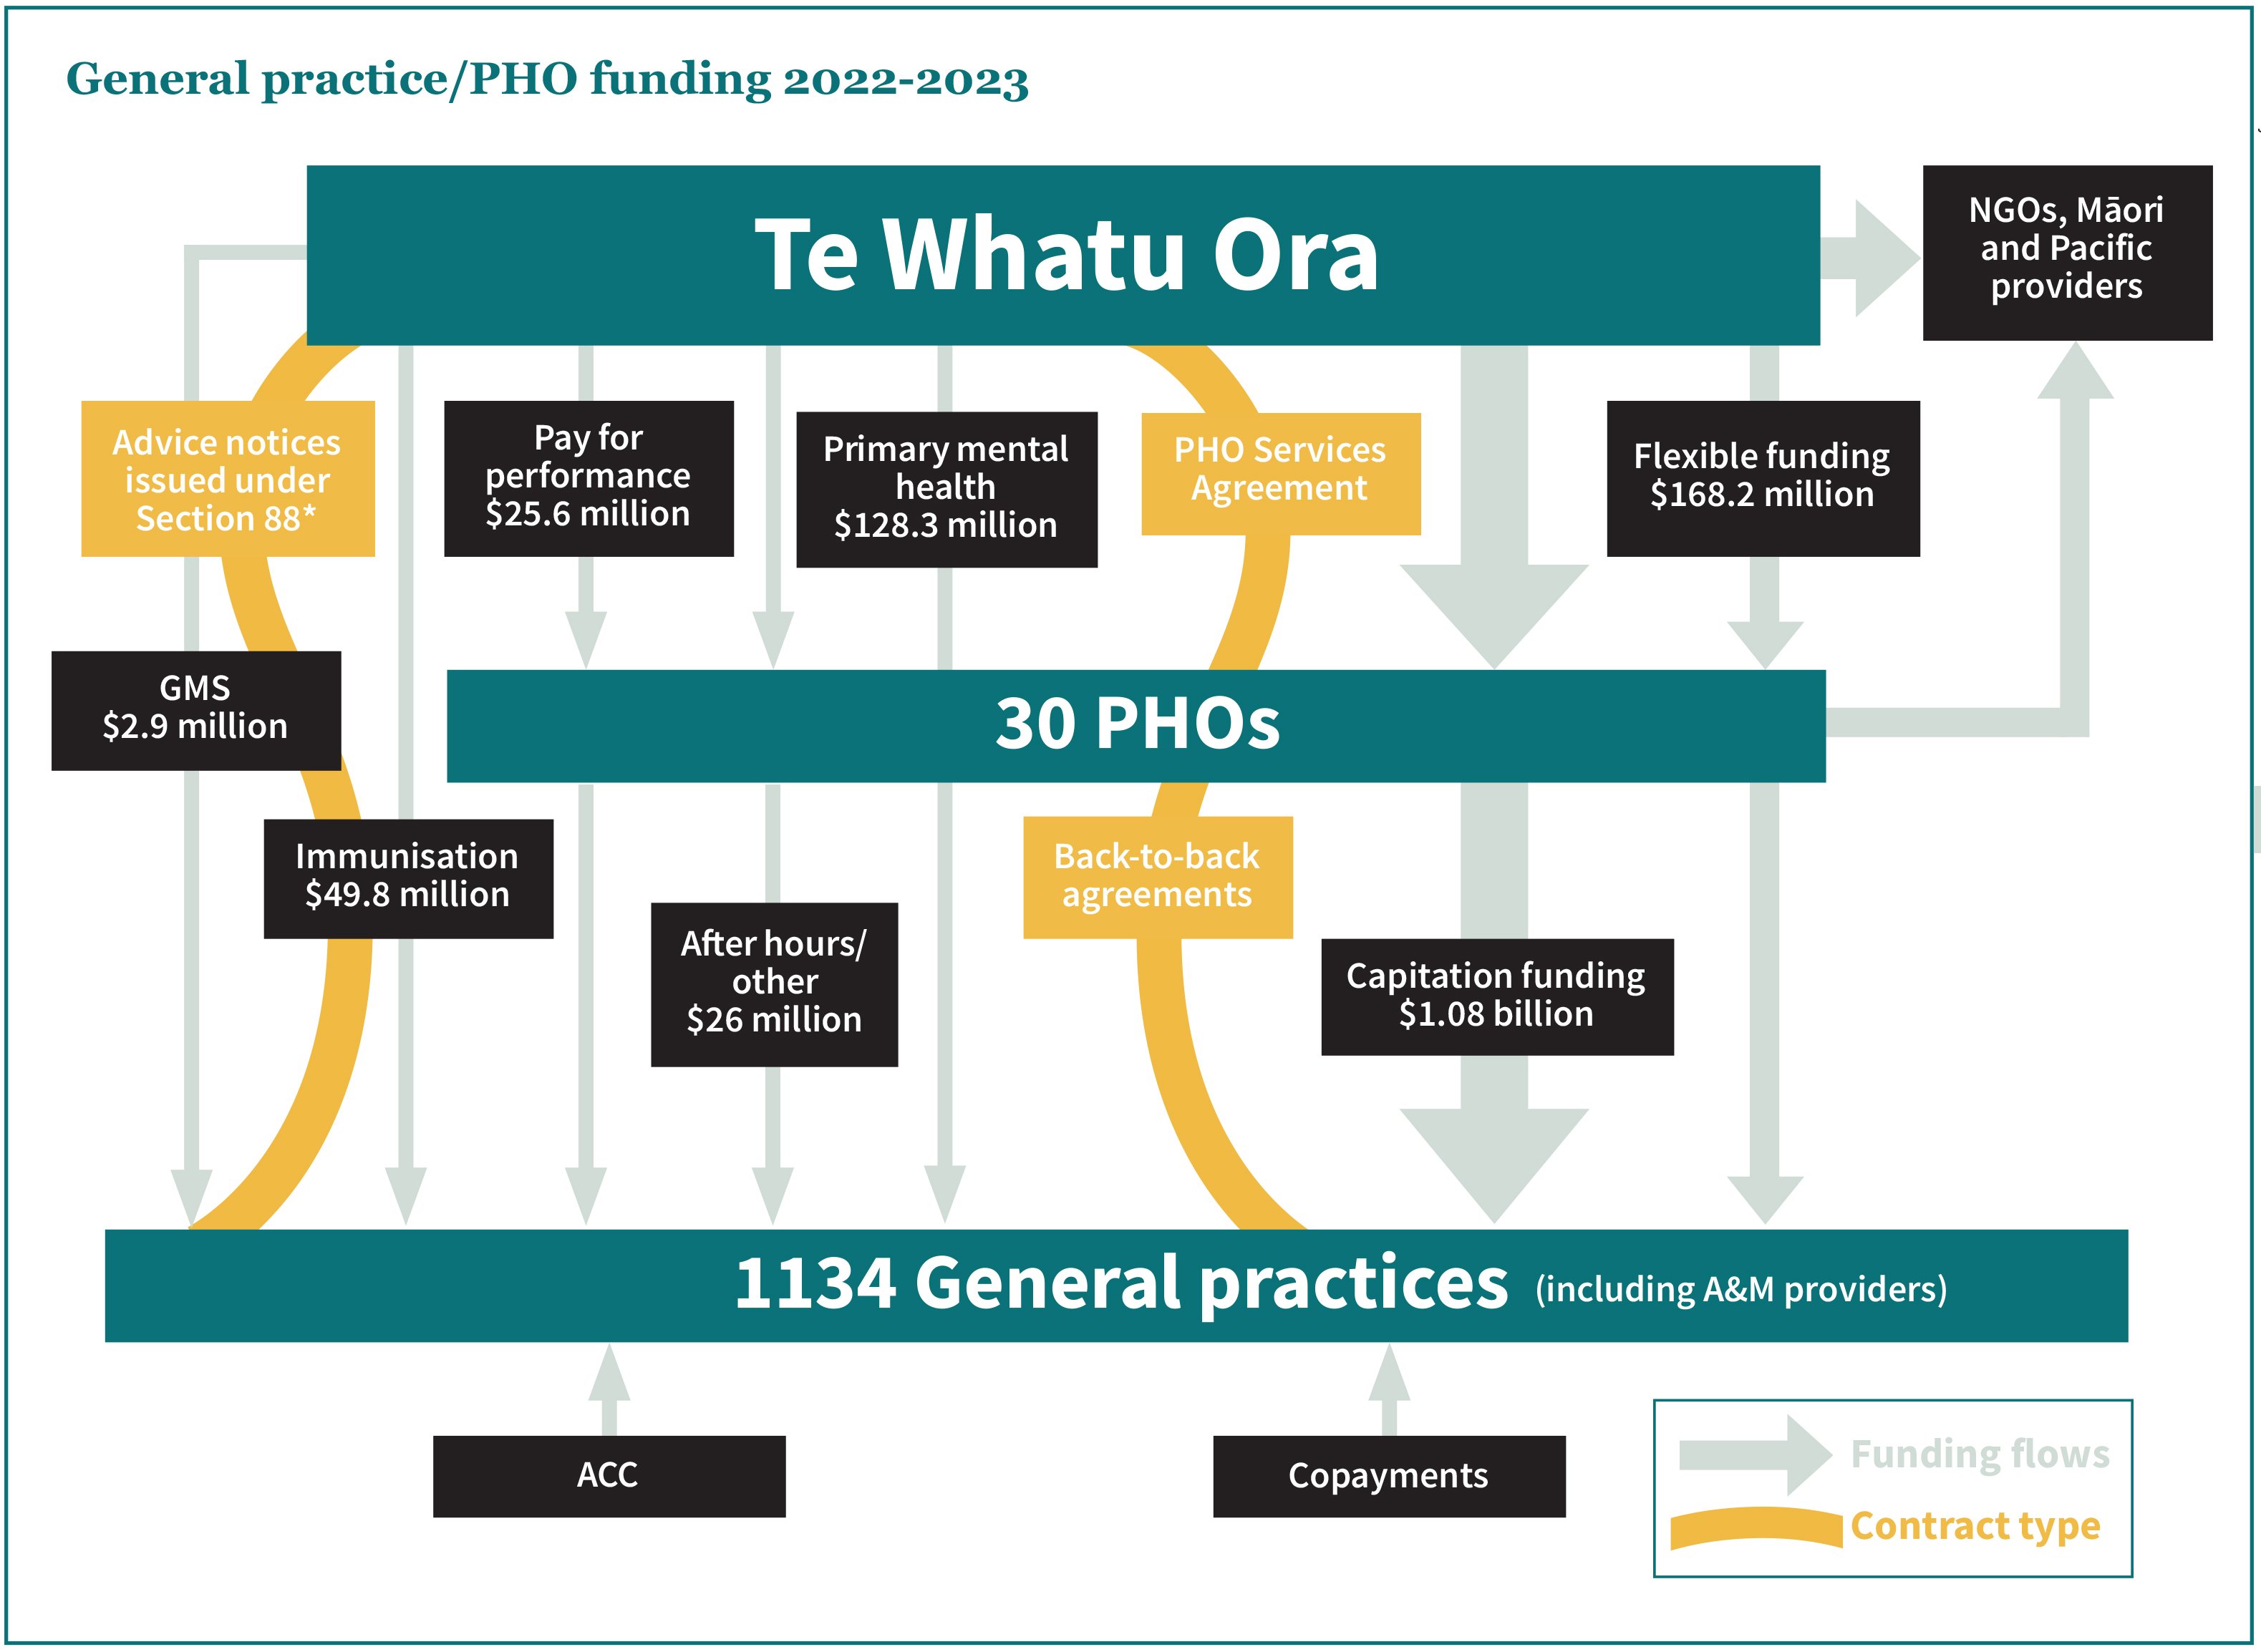
In the past, the Ministry of Health produced a handy diagram showing how primary and community healthcare dollars were divvied out through the maze of funding and contract lines to the PHOs, general practices and other service providers.
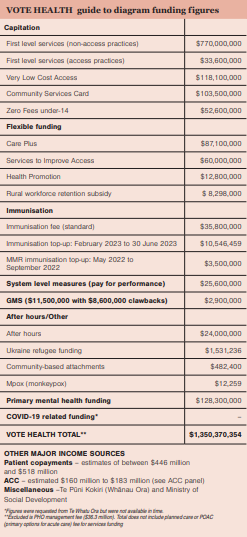
New Zealand Doctor Rata Aotearoa asked new funder Te Whatu Ora to update the dollars allocated to primary care in 2022/23, either directly to practices or via PHOs, so we could recreate a section of that diagram.
The agency responded, under the Official Information Act 1982, with a list of funding streams (including $128.3 million in primary mental health services) adding up to $1.48 billion or about 6 per cent of Vote Health’s $24 billion (see chart and table).
The dollar details for nearly all those funding streams are set down in primary care’s main funding contract, the PHO Services Agreement, which is due to be replaced, although no consultation timeline or new funding model is yet to be proposed.
In the interim, Te Whatu Ora this month informed general practice leaders it had approved a 5 per cent contract increase “across national contracts including primary care” from 1 July.
What is clear is that general practice leaders see 5 per cent as too little, and maybe too late, for a sector hit hard by burnout, inflation and workforce shortages.
What is not clear is 5 per cent of which dollar amount? (Budget documents do not show a base funding line for the PHO Services Agreement contract.)
And it’s not clear how widely the 5 per cent increase may be applied. This year’s signalled 5 per cent increase could well apply to different funding bundles than last year’s 3 per cent increase.
The biggest dollop of dollars into the primary care funding bucket is always capitation funding.
What people label as “capitation funding” is variable, however, so comparing “capitation increases” can be like comparing apples and pears.
In the purest sense, capitation (or per head) funding is the $803.6 million paid this year to general practices for delivering First Level Services to their enrolled patients plus $118.1 million in Very Low Cost Access funding and the $156.1 million in Community Services Card and Zero Fees under-14 patient fee subsidies.
But some use “capitation funding” to also include other PHO Services Agreement funding. For example, the capitation funding definition used in last year’s capitation review by research organisation Sapere included the Services to Improve Access ($60 million) and Health Promotions ($12.8 million) flexible funding pools while excluding the Care Plus pool ($87.1 million).
As well, the way flexible funding pool streams are spent on services varies from PHO to PHO, affecting the proportion going directly to general practices.
Last year, the 3 per cent increase imposed by the funders was not applied to the PHO Services Agreement’s flexible funding streams, including rural streams, or the $36.3 million PHO management fee. This year, Te Whatu Ora says it wants to discuss with sector representatives how the 5 per cent “funding envelope” is used across the full range of PHO Services Agreement funding streams.
New Zealand Doctor tried to get a handle on how much patients contribute to general practice funding from their own pockets (and/or their insurance companies).
A rule of thumb used to be that general practice income was roughly a 50/50 split between government funding and patient fees.
In 2015, the Peter Moodie-led Report of the Primary Care Working Group on General Practice Sustainability stated that patient copayments “still constitute half, or more than half” of many general practice’s revenue.
However, on latest estimates, income from patients’ fees now looks more like a third of total core revenue, with patients spending in the order of $500 million compared to the $1 billion-plus in government capitation and fee subsidy funding.
Exact figures on fees aren’t readily available. The capitation report by Sapere – A Future Capitation Funding Approach – used household spending statistics and estimated that patients spent $446 million in general practice copayments in 2021/22.
In a Te Whatu Ora 2022 funding briefing, it is calculated that copayment revenue that year was $502 million. This compared with a 2017/18 peak of $506 million followed by a dip in fees revenue to between $472 million and $488 million for the intervening years.
Te Whatu Ora attributes the dip to the likely impact of increasing Community Services Card subsidies and introducing Zero Fees for under-14s. The agency has predicted fees revenue will reach about $518 million in 2022/23. The PHO Services Agreement limits the extent that practices can raise their prices to patients (any excess can be shot down by fees reviewers).
Practices’ individual fee revenue varies widely. A quick search of general practice websites shows enrolled adults can pay zero or up to $19.50 for a consultation at a Very Low Cost Access practice and up to $70 to $86 at some Wellington and Auckland practices.
Green Cross Health general manager medical Wayne Woolrich says copayments range from 20 to 35 per cent of its practices’ income, with fee income trending downwards in recent years due to COVID-19.
South Link Health chief executive Karl Andrews says the model for its practices is based on capitation providing roughly 60 per cent of practice funding, with the other 40 per cent mostly a mix of patient fees and flexible funding streams that vary from region to region.
Findex business advisory manager Leicester Gouwland says at the higher-charging, non-Access end of the general practice sector, 50 per cent or more of income likely still comes from copayments.
The ratio of sector income from patients may be trending down, but that forecast $518 million is still the equivalent of 2.15 per cent of Vote Health’s $24 billion allocation.
Patients will remain an essential funding source unless, or until, general practice gains a bigger share of that much sought-after bucket of health dollars.
New Zealand governments first started subsidising patient visits to their local general practice in 1941. The medical profession had blocked the first Labour Government’s plans to introduce free primary care alongside free hospital care via the Social Security Act 1938.
As a compromise, the General Medical Services (GMS) benefit was introduced in the war years, starting at seven shillings and sixpence or about 75 per cent of the average patient fee. By 1950, medical practitioners were being paid nearly £3.4 million in medical and maternity benefits – just over 20 per cent of the Department of Health’s then £15.5 million budget.
The growth in modern hospital services saw the medical and maternity benefit share of the $202 million health budget drop to around 6 per cent by 1970. The health budget had swollen to $3.9 billion by 1990 with the medical and maternity benefit share of that around 7 per cent. But the GMS subsidy for a standard adult visit was just $4 in 1990 ($12 for beneficiaries and the chronically ill plus $16 for children) while the average adult patient fee was up to around $31, creating significant barriers for patients accessing care.
The 1990s saw some GMS subsidy increases, a surge in GPs forming independent practitioner associations to deliver contracted primary healthcare services and the shift in maternity care from GPs to midwives. Then came the 2001 Primary Health Care Strategy which brought about the biggest shake-up in primary care funding for 60 years. With this came the change in 2003 from per-visit subsidies to capitation funding per enrolled patient, regulation of patient fees/copayments, and creation of PHOs and the PHO Services Agreement contract.
By 2020, General Practice NZ estimated that government primary care funding, via the PHO Services Agreement, was about $1.08 billion or 5.45 per cent of the nearly $20 billion Vote Health budget in 2019/20.
TELL US WHAT YOU THINK
Please add your comments using the comment function below and, remember, if in doubt, check out our comment policy.


![[Image: Drew Beamer on Unsplash]](/sites/default/files/styles/cropped_image_4_3/public/2023-02/drew-beamer-Se7vVKzYxTI-unsplash.jpg?itok=C7-gZOj_)


